xboard.AI Plugin Ecosystem
Extend xboard.AI capabilities with over 30 professional plugins ready to use. Custom dashboard items, advanced visualizations, and enterprise-ready integrations.
All plugins are available through the central Hub and ready for one-click installation
Funnel chart visualization for conversion rate and sales pipeline analysis with interactive drill-down and customizable tooltips.
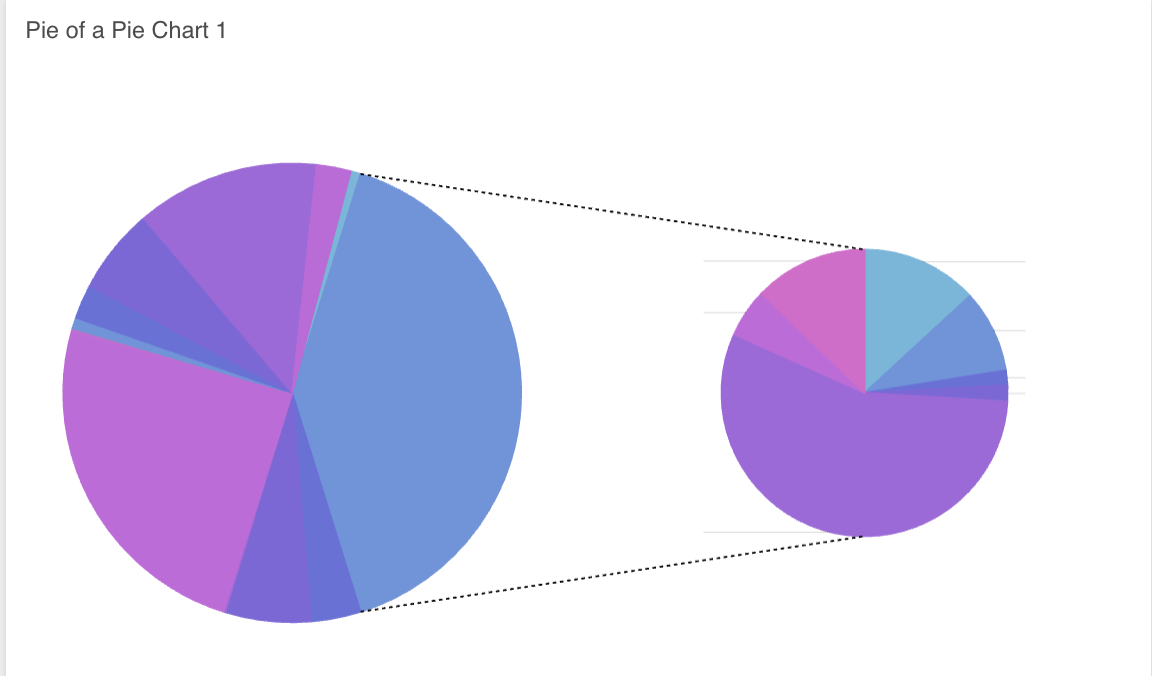
VisualizationPie chart with secondary detail for hierarchical analysis. Ideal for percentage breakdowns with sub-categories.
VisualizationSolid circular gauge in speedometer style for real-time KPIs and metrics. Supports colored ranges and smooth animations.
VisualizationNetwork visualization with dynamic nodes and connections. Perfect for relational analysis, org charts, and dependency graphs.
VisualizationOval track visualization with lanes and progress bars. Ideal for competitive comparisons and animated race charts.
VisualizationAnimated bullet chart for comparing values vs targets. Supports min/max ranges and colored performance indicators.
VisualizationInteractive pie chart with drag-and-drop slices. Allows manual reorganization and dynamic highlighting.
VisualizationPolar chart for multi-dimensional circular visualizations. Spider charts and radar plots with multiple overlays.
VisualizationHorizontal bars for side-by-side comparisons. Supports stacking, grouping, and variance indicators with custom colors.
VisualizationHierarchical decomposition tree for KPI drill-down. AI-powered suggestions to identify key drivers.
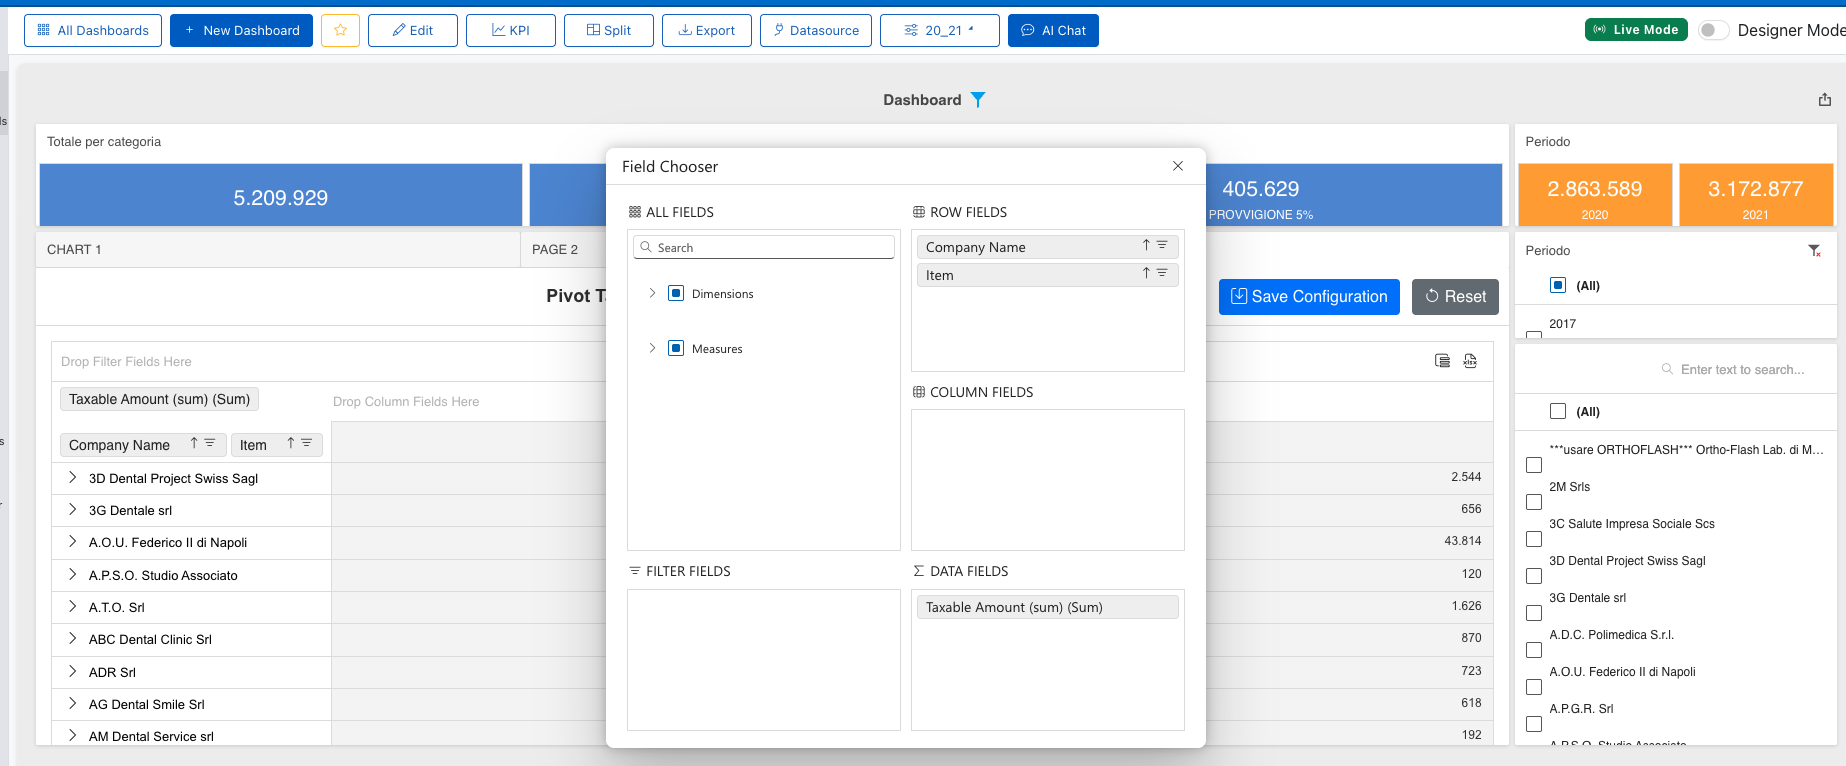
AnalysisFully interactive pivot table with drag-and-drop. Custom calculations, subtotals, and integrated Excel export.
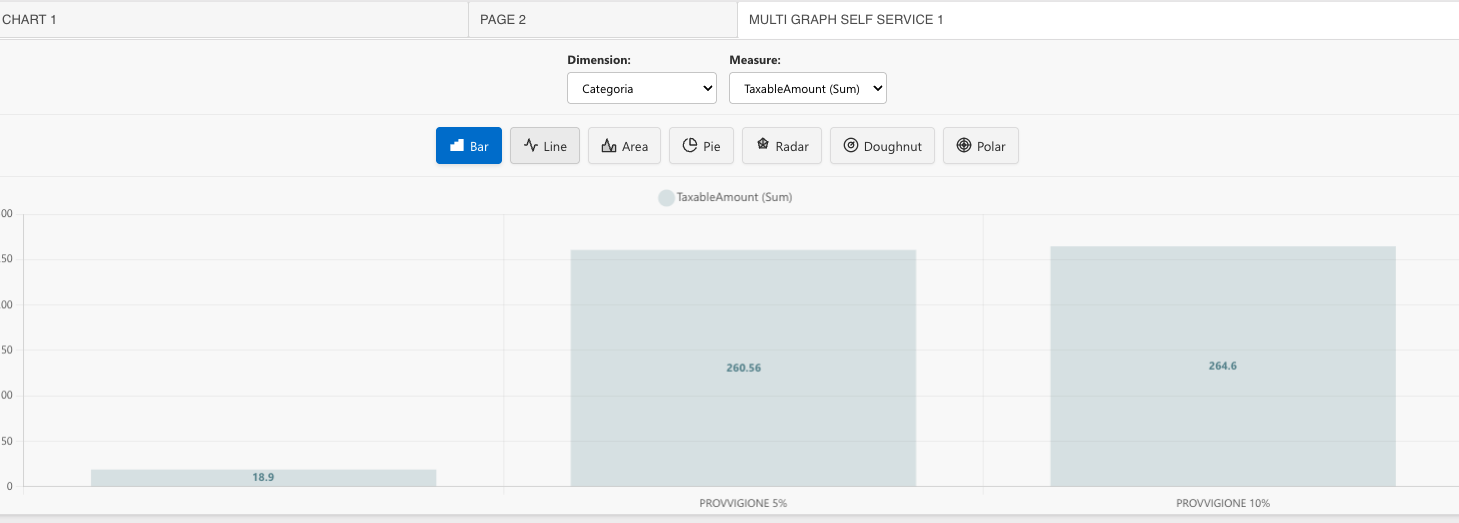
AnalysisDashboard item to dynamically create multiple charts. Predefined templates and advanced customization without code.
AnalysisSimplified table with sorting, filtering, and pagination. Conditional formatting and custom cell rendering.
AnalysisAdvanced funnel chart based on D3.js with smooth animations. Automatic conversion rate calculation and drop-off analysis.
AnalysisTree view for hierarchical data with lazy loading. Supports multiple selection, checkboxes, and custom icons.
AnalysisComplete Gantt diagram for project management. Task dependencies, critical path, resource allocation, and interactive timeline.
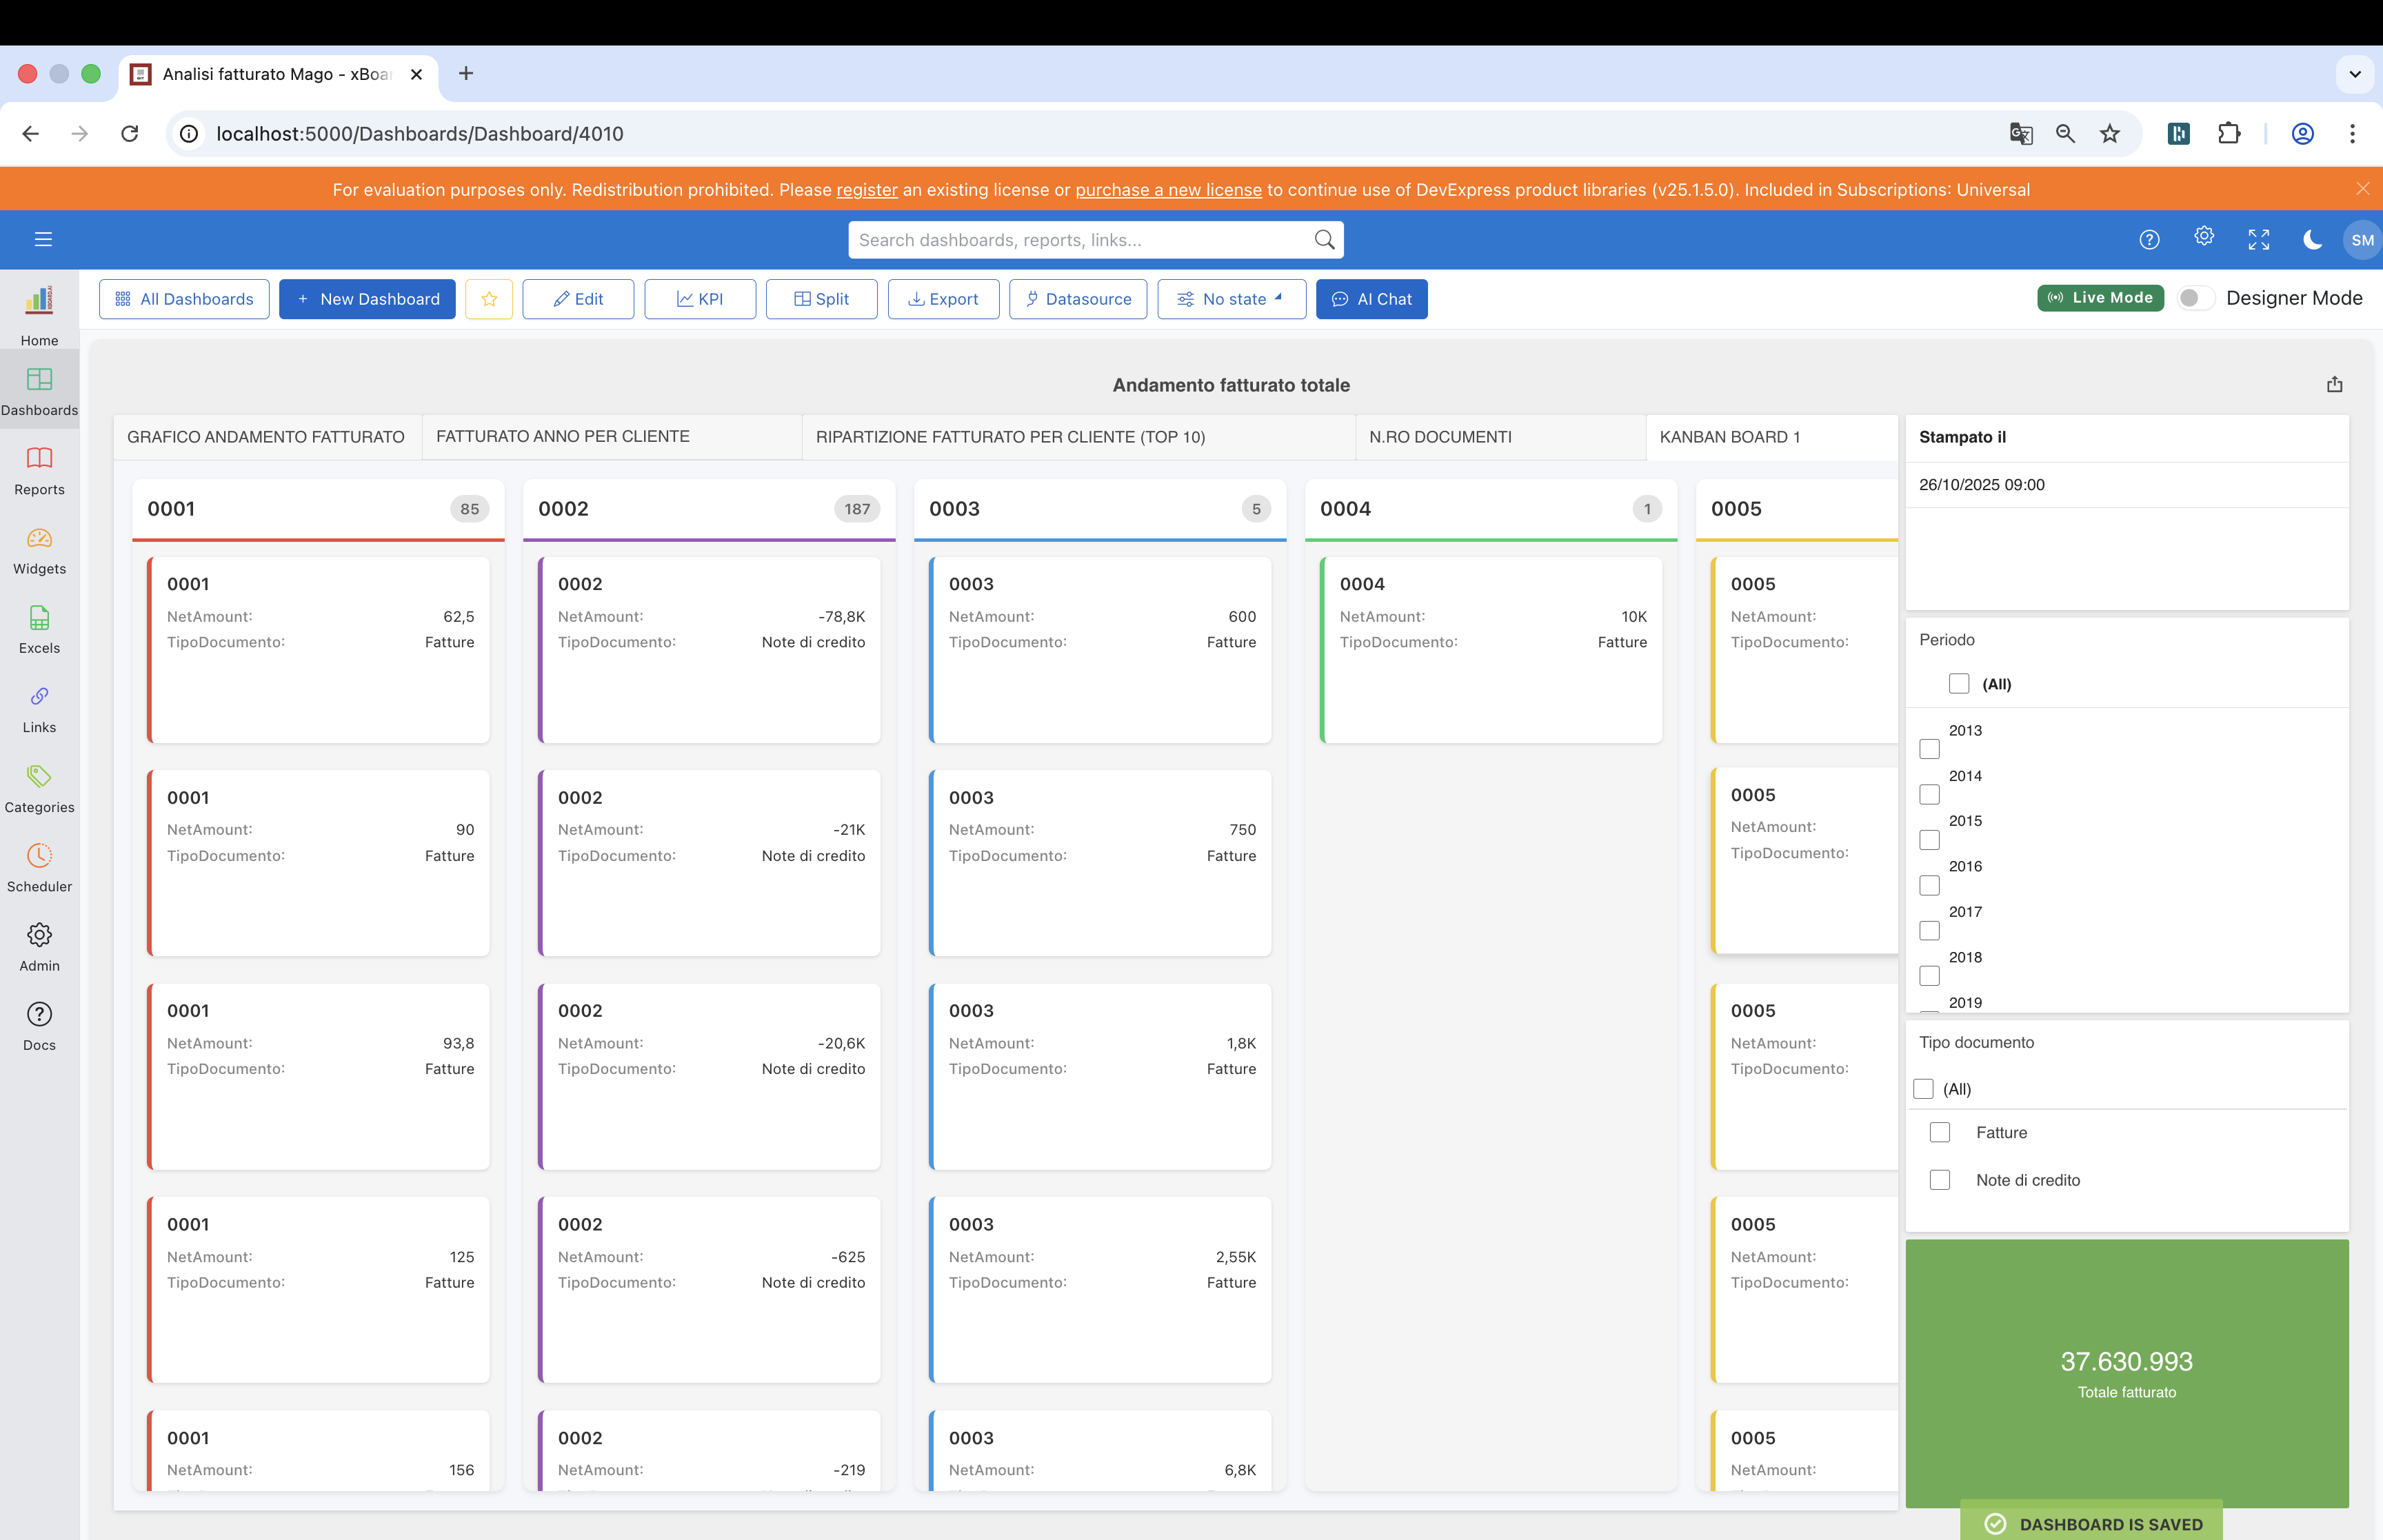
Project ManagementDrag-and-drop Kanban board for workflow management. Swimlanes, WIP limits, card customization, and Scrum integration.
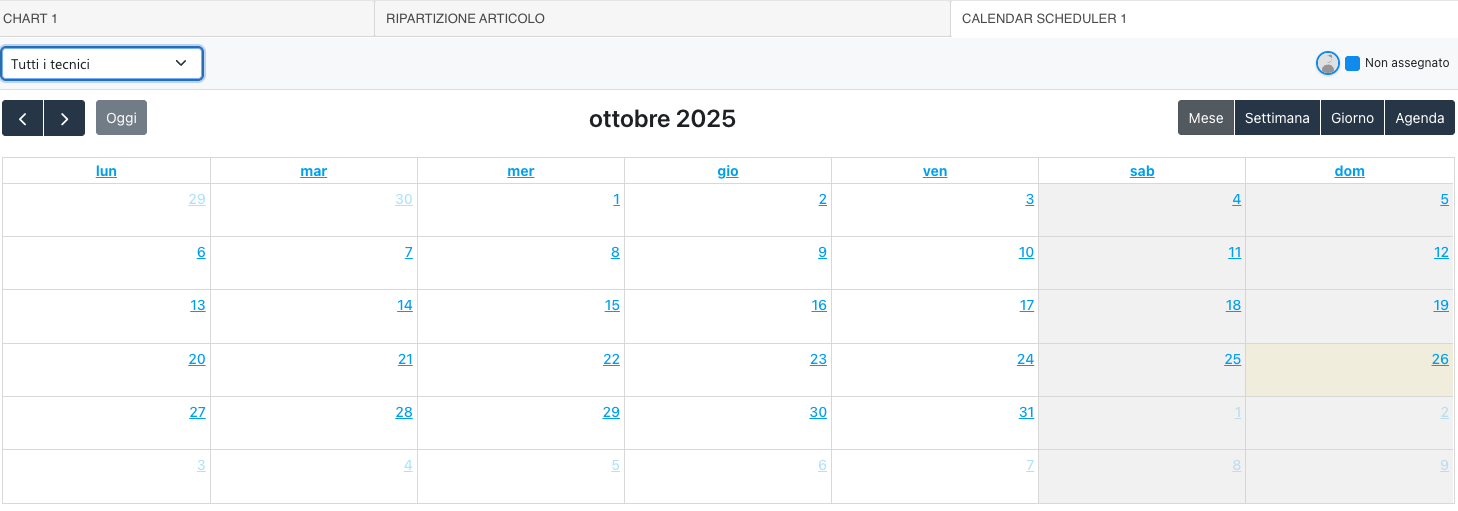
Project ManagementComplete calendar with event and appointment management. Day/week/month view, recurrences, and integrated reminders.
SchedulingEnterprise DevExpress scheduler with advanced features. Resource scheduling, appointment templates, and timezone support.
SchedulingReal-time notifications and alerts list. Priorities, categories, quick actions, and integration with corporate notification system.
MonitoringInteractive maps with markers, heatmaps, and geolocation. Supports OpenStreetMap, Google Maps, and custom layers.
GISIntegrated AI chat assistant with LLM. Supports Ollama, OpenAI, contextual data analysis, and automatic insight generation.
AIEmbedded iframe to display external websites. Supports authentication, automatic refresh, and responsive scaling.
IntegrationAdvanced image viewer with zoom, pan, and lightbox. Supports gallery, slideshow, and lazy loading for performance.
MediaCustom HTML renderer with CSS and JavaScript support. Integrated template engine and dynamic data binding.
ContentWYSIWYG rich content editor for notes and documentation. Complete formatting, images, tables, and PDF export.
ContentParameter controls for interactive filtering. Dropdowns, sliders, date pickers that update the entire dashboard.
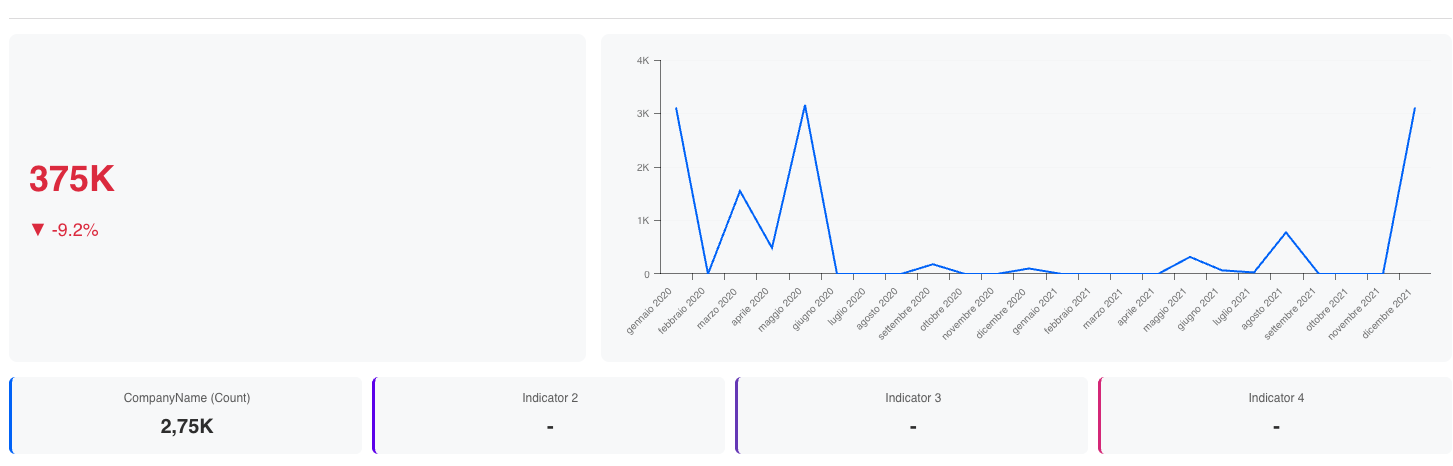
ControlsAdvanced KPI card with sparklines, trends, and comparisons. Conditional coloring, dynamic icons, and drill-through actions.
KPISimplified KPI card with modern design. Main value, delta percentage, target indicator, and optional mini-chart.
KPIView some of our most popular plugins integrated in dashboards
Complete drag-and-drop Kanban board for agile workflow management
Interactive pivot table with drag-and-drop and custom calculations
Dynamic creation of multiple charts with predefined templates
Complete calendar with event management, appointments, and recurrences
Advanced KPI card with sparklines, trends, and dynamic comparisons
Pie chart with secondary detail for hierarchical analysis
Download and install plugins from the Hub with one click. Auto-deployment, dependency resolution, and automatic configuration.
Notifications of new available versions. Integrated update manager with automatic rollback in case of issues.
All plugins support custom themes, corporate colors, and personalized branding for perfect match with company identity.
Every plugin is optimized for desktop, tablet, and mobile. Adaptive layout and touch-friendly for optimal user experience.
Native export to PDF, Excel, Image for all plugins. Optimized dimensions and guaranteed professional formatting.
Complete support for master-filter and interactive drill-down. Automatic synchronization with other dashboard items.
Create your own plugins with JavaScript/TypeScript SDK. Starter templates, complete examples, and detailed documentation.
Code validation, sandboxing, granular permission system. Every plugin is tested and approved before publication.
Lazy loading, virtual scrolling, intelligent caching. Efficient handling of large datasets without compromise.

Access the Hub to download plugins or create your own custom plugins with our SDK