BI and Reporting Platform
xboard.AI offers four integrated modules to cover all data analysis, reporting, document management and automation needs, with AI-powered and cloud-ready support.
xboard.AI offers 6 complete functional areas to cover all enterprise needs
30+ widgets, dynamic filters, drill-down, multi-format export
Complete designer, reusable templates, automatic scheduling
OpenAI, Claude, Gemini, Ollama, Azure OpenAI integrated
Complete automation with Quartz.NET, AI Summary, email automation
xBoardAI.Designer WinForms + integrated web-based designers
Azure AD, RBAC, encryption, audit logging, multi-tenancy
All features are described in detail in the following sections
WinForms Desktop Application for Professional Design and Publishing
Drag-and-drop designer with complete toolbox of dashboard widgets and report components. Professional interface based on DevExpress WinForms with real-time preview.
Work locally without internet connection. Test data sources, SQL queries, formulas and visualizations on your computer before production publishing.
Direct configuration of SQL Server, MySQL, PostgreSQL, Oracle, Excel connections. Immediate query testing and preview of extracted data.
Complete dashboard and report preview with real data. Test filters, drill-down, interactions and parameters before deployment.
Publish dashboards and reports directly to the web platform with one click. Automatic upload via secure API with API key authentication.
Download existing dashboards from the web platform, edit them locally with the Designer and republish updated versions maintaining IDs and permissions.
Save dashboards in .xbd format (XML) and reports in .repx format for sharing, backup and versioning on source control systems (Git, SVN).
Tenant-specific configuration to work on multiple organizations. Quick switch between tenants and user permission management directly from the Designer.
Support for dynamic C# scripting, calculated fields, custom data transformation. Integrated code editor with syntax highlighting and IntelliSense.
Advanced interactive dashboards with over 30 widgets and visualizations
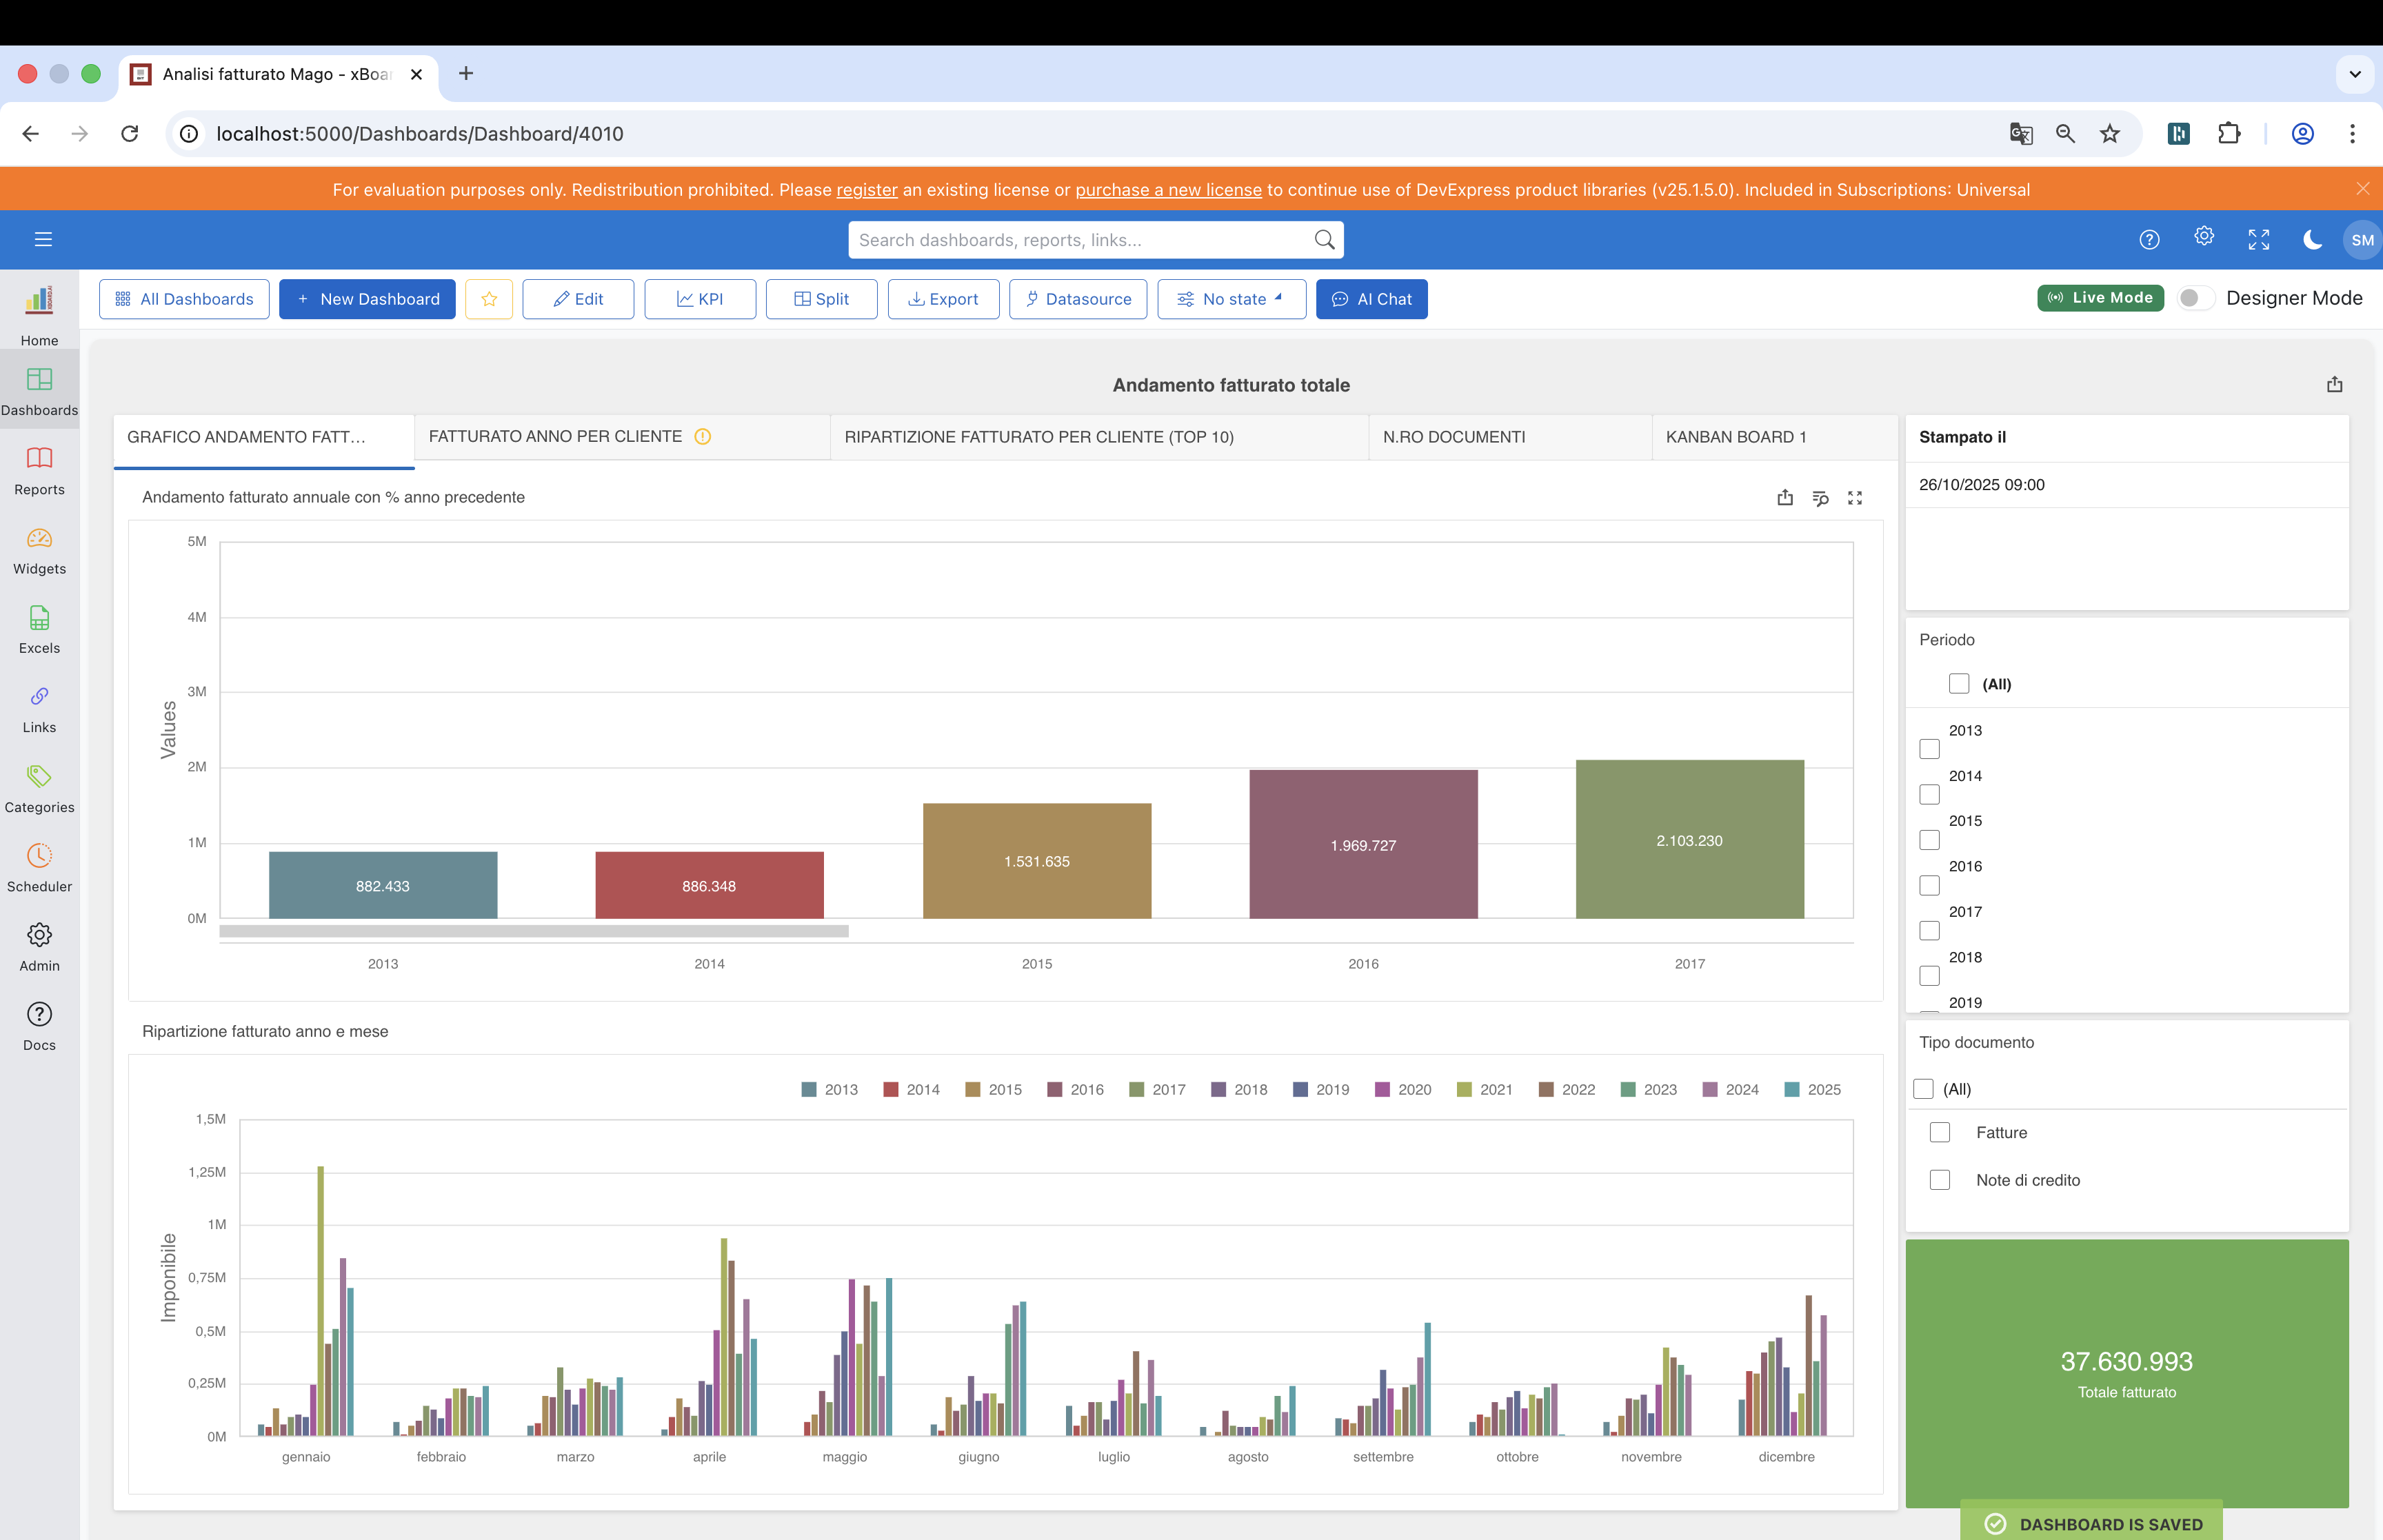
Intuitive drag-and-drop designer based on DevExpress Dashboard. Over 30 widget types: chart, pivot table, grid, gauge, map, treemap, card, image, text and many more.
Master-detail dynamic filter system. Hierarchical drill-down, global filters, cross-widget selections with real-time correlated data highlighting.
Direct connection to SQL Server, MySQL, PostgreSQL, Oracle. Excel, JSON, REST API support. Custom queries with parameters, stored procedures and data transformation.
Calculated fields with complex formulas, multiple aggregations, window functions. Support for DAX-like expressions and advanced statistical functions.
Dashboard export to PDF, Excel, Image (PNG/JPG) with optimized layout. Preservation of formatting, colors, applied filters and annotations.
Public/private sharing with granular access control. Public links with expiration, password protection and view tracking.
Fully responsive dashboards optimized for desktop, tablet and smartphone. Automatic adaptive layout with intelligent widget rearrangement.
Over 30 ready-to-use custom plugins: Gantt, Kanban, AI Chat, Maps, Calendars, Advanced KPI, Decomposition Tree and much more. Extensible with JavaScript/CSS.
Predefined themes (Light/Dark) and customizable. Multi-tenant branding with logo, corporate colors and custom layout for each organization.
Complete reporting system with advanced designer and automatic distribution
Professional report designer based on DevExpress Reporting. Master-detail bands, subreports, pivot tables, charts, barcodes, QR codes and custom components.
Enterprise-ready template library: invoices, orders, labels, financial reports. Custom template creation with placeholders and parametric data binding.
Report parameters with validation, dynamic lookups, cascade filters and default values. Automatic UI for parameter input with calendars, dropdowns and multi-select.
Automatic report sending via email with Quartz.NET scheduling. PDF/Excel attachments, customizable HTML email templates and multiple recipients.
Direct printing to network printers, PDF export with digital signatures, watermarks, password protection and granular editing/printing permissions.
Multi-level hierarchical reports with nested subreports. One-to-many relationships, advanced grouping, automatically calculated subtotals and summaries.
DevExpress chart integration: line, bar, pie, area, scatter, funnel, radar. Dual Y-axis, multiple series, trendlines and custom annotations.
Support for over 50 barcode formats: EAN, UPC, Code128, DataMatrix, PDF417, Aztec. Dynamic QR Codes with URL tracking and inventory system integration.
Localized reports with multi-language support. Automatic label translations, regional currency/date formatting and complete Unicode fonts.
Integrated Excel viewer and editor for advanced data analysis
Complete Excel format support: .xlsx, .xls, .xlsm. Import/export without data loss, formatting preservation, compatible formulas and macros.
Interactive pivot tables with multi-level grouping, custom aggregations, calculated fields and configurable layouts. Automatic data refresh.
Over 400 supported Excel functions: VLOOKUP, INDEX/MATCH, SUMIFS, array formulas, statistical, financial and text functions with IntelliSense.
All Excel chart types: columns, lines, pie, area, scatter, bubbles, radar. Advanced formatting with customizable styles, colors and layouts.
Conditional formatting with multiple rules: color scales, data bars, icon sets. Cell highlighting based on custom formulas and comparisons.
Advanced AutoFilter, multiple filters per column, text search, color filters. Multi-level sorting with grouping and subtotal preservation.
Direct database connection for spreadsheet data import/export. Automatic refresh, custom SQL queries and bidirectional synchronization with data sources.
Password protection for sheets and cells, granular editing permissions, formula locking. Protected ranges with specific user/group access.
Comments and annotations with author tracking, change history, file versioning. Email notifications on changes and integrated approval workflows.
Enterprise scheduling system with Quartz.NET for complete automation
Quartz.NET-based scheduler with Cron expression support. Recurring jobs with flexible interval configuration: minutes, hours, days, weeks, months.
Scheduled automatic report sending via email. Customizable HTML templates, multiple attachments (PDF/Excel), dynamic recipients based on queries.
Automatic data synchronization from external sources: ERP, CRM, remote databases. Scheduled import/export with data transformation and error validation.
Scheduled execution of custom C# snippets. Access to application context, databases, external APIs. Automatic logging and error handling.
Automatic dashboard cache refresh at scheduled intervals. Pre-calculation of heavy aggregations, cache warm-up for optimal performance.
Automatic database maintenance: old log cleanup, document archiving, temporary file deletion, index and statistics optimization.
Alerting system with threshold monitoring. Email/SMS notifications on critical KPIs, application errors, threshold exceeded and data anomalies.
Complete job execution history with detailed logs, timestamps, duration, output. Automatic retry on failure with configurable exponential backoff.
Real-time scheduler monitoring dashboard. Visualization of active jobs, queues, next executions, failure rate and performance metrics with drill-down.
Multi-level data protection with advanced authentication and granular access control
Complete integration with Microsoft Azure AD (Entra ID) for enterprise Single Sign-On. OAuth 2.0, OpenID Connect support, synchronized security groups.
Row-level security to filter data based on user/group. Dynamic policies configurable via SQL expressions and custom logic.
API key management for secure programmatic access. Configurable expiration, IP whitelisting, rate limiting and usage tracking per key.
Role-based access control with granular permissions. User groups, role inheritance, permission inheritance and specific overrides.
MFA support with TOTP (Google Authenticator), SMS, email. Mandatory configuration for administrative roles and trusted device management.
Complete logging of all user operations: logins, data changes, exports, configurations. Change tracking with before/after snapshots.
Data encryption at-rest and in-transit. SSL/TLS for communications, database-level encryption for sensitive data, automatic key rotation.
Complete data isolation between tenants with database-level separation. Custom branding, independent configurations, segregated backups per tenant.
GDPR, SOC 2, ISO 27001 compliance. Configurable data retention policies, right-to-be-forgotten, automatic data export and anonymization.
Complete automatic scheduling system with email distribution and AI Summary
Advanced scheduling based on Quartz.NET with complete Cron expression support. Precise time configuration, weekdays, custom intervals with intuitive UI.
Automatic report/dashboard sending via email with customizable HTML templates. PDF/Excel attachments, multiple recipients, CC/BCC, ZIP compression for large files.
Configurable recipient lists with user groups, roles, dynamic SQL queries. Per-recipient customization with specific parameters and row-level filters.
Automatic AI summary generation for scheduled reports. Executive summary, bullet points, key insights and AI-identified trends inserted in email body or PDF.
Scheduled parameter configuration: dynamic date ranges (today, last week, current month), default values, cascade filters. Each job can have specific parameters.
Scheduled export in PDF, Excel, Image. Paper format configuration (A4, Letter), orientation (portrait/landscape), compression, multi-page merge, custom watermark.
Predefined templates for AI summary: Executive, Technical, Financial. Configurable positioning (email start, email end, PDF first page). Customizable AI prompts.
Complete log of all scheduled executions with timestamp, duration, recipients, attachments. Error tracking, automatic retry, failure notifications for administrators.
Immediate job execution for testing without waiting for schedule. Email preview before sending, test email sending to specific addresses, configuration validation.
Advanced widget display system with automatic slideshow mode for monitoring walls
Page display with custom layout of dashboards and reports. Responsive grid with drag-and-drop, widget resizing, row/column configuration per page.
Automatic widget rotation with configurable intervals (from 5 seconds to hours). Ideal for monitoring walls, corporate TV displays, digital signage and control rooms.
Widget display order configuration: sequential, random, custom priority. Skip specific widgets, custom duration per slide, configurable transitions (fade, slide).
Full screen display to maximize usable space. Auto-hide navigation bar, minimal controls, layout optimization for high-resolution displays and multiple monitors.
Automatic slideshow activation/deactivation based on times and days of the week. Time ranges (e.g. 8:00-18:00), specific days, campaign start/end dates.
Manual navigation with on-screen controls: play/pause, next/previous slide, progress bar. Keyboard support (arrows, space) and touch gestures for tablets and touch displays.
Automatic slideshow pause when user interacts with a widget. Resume after inactivity, configurable timeout, automatic restart after idle period.
Slideshow can include both interactive dashboards and static reports. Automatic alternation, real-time data refresh for dashboards, intelligent caching for optimal performance.
Progress bar color configuration, control position (center, bottom, top), transitions (fade, slide, zoom). Automatic light/dark themes based on time or user preferences.
Dashboard Designer and Report Designer fully integrated in the browser without installations
Complete DevExpress Dashboard designer accessible from any browser. Drag-and-drop widgets, data binding configuration, filters, parameters. Zero client-side installations.
Professional DevExpress report designer in the browser. Master-detail bands, subreports, charts, pivot tables. Intuitive visual interface accessible from Windows, Mac, Linux.
Guided wizard for data source configuration directly from the browser. SQL connections, visual query builder, real-time connection test, extracted data preview.
Immediate preview during design with real data. Fast switch between design mode and preview mode. Test filters, parameters, interactions without saving or page refresh.
Collaborative dashboard/report editing. Editing lock to prevent conflicts, automatic versioning, change history with point-in-time rollback.
Designer optimized for touch devices. Adaptive interface for tablets, gesture support, touch-friendly controls. Design dashboards even from iPad or Android tablets.
Automatic saving during design, browser crash recovery. Version history with restore points, unlimited undo/redo, automatic pre-publish backup.
Advanced editor for calculated fields and conditions. Syntax highlighting, function autocomplete, real-time validation, contextual help on available functions.
Immediate dashboard/report publishing after design. Permission configuration, public/private sharing, user notifications on new available versions.
Complete support for major AI providers with flexible configuration and automatic failover
Native OpenAI API integration for GPT-4, GPT-4o, GPT-4o-mini. API key configuration, custom endpoints, temperature and max tokens control. Streaming response support.
Complete Azure OpenAI support with custom deployments. Azure private endpoints, quota management, Azure AD integration for authentication, enterprise compliance.
Claude 3.5 Sonnet, Opus, Haiku integration. Anthropic API configuration, context window control, advanced system prompts, streaming support for long responses.
Local AI model execution via Ollama. Llama 3.2, Mistral, CodeLlama, Gemma, Qwen and 100+ models. Total privacy, zero API costs, custom model customization.
Google Gemini 1.5 Pro/Flash support. Gemini API integration with API key configuration, safety settings, generation config, multimodal capabilities.
Centralized AI provider management from Admin Panel. Provider activation/deactivation, connection test, default provider configuration, multiple models per provider.
Automatic failover between providers on errors or quota exceeded. Primary/secondary provider configuration, retry logic, circuit breaker pattern for resilience.
AI response caching for frequent queries, configurable timeouts, rate limiting for cost control, token usage and cost monitoring per provider.
Specific model selection per use case: fast models for quick queries, advanced models for complex analysis. Ollama model auto-discovery, per user/group configuration.
Pre-extracted data snapshots for optimal performance and offline data access
Data extraction from complex queries into optimized .dat files. Dashboards use snapshots instead of live queries for 10-100x superior performance on large datasets.
Real-time switch between Live mode (direct database query) and DAT (pre-extracted snapshot). Dashboards use DAT mode for scheduled reports, Live mode for real-time analysis.
Automatic DAT file update with Quartz.NET scheduling. Daily, weekly, monthly or custom refresh. Nighttime execution to minimize database impact.
DAT file from custom SQL queries or applied filters. Data pre-filtering per tenant, period, region. DAT file size reduction and dashboard performance improvement.
DAT file size tracking, row count, last refresh date. Live vs DAT mode performance comparison, slow query identification candidate for DAT extraction.
Dashboards working in DAT mode even without database connection. Ideal for disconnected environments, offline demos, disaster recovery backup strategy.
DAT file historicization with timestamps. Historical trend analysis, snapshot comparison different periods, rollback to previous versions if needed.
Automatic DAT file compression to reduce storage. Columnar storage optimization, duplicate elimination, efficient encoding for specific data types.
Immediate manual DAT file refresh without waiting for schedule. Refresh button in admin dashboard, user notification on available data update.
Intelligent schema management system with AI-powered descriptions and data profiling
Automatic database scanning for schema discovery: tables, columns, data types, FK relationships, indexes. Incremental synchronization on database schema changes.
Automatic table and field description generation via AI. Column name analysis, sample data, patterns. Business-friendly descriptions for non-technical users.
Powerful cross-table/field search with full-text search. Find columns by name, type, description. Advanced filtering by data type, FK presence, indexes, nullability.
Statistical column analysis: min/max, distinct values, null percentage, pattern detection. Anomaly identification, optimization suggestions, data quality scoring.
Graphical visualization of table relationships with interactive ER diagrams. FK chain drill-down, complex JOIN path identification, optimal JOIN suggestions.
Custom tagging system for tables/fields: PII, sensitive, deprecated, business-critical. AI automatic categorization, tag filtering, data governance policies.
Schema documentation export to HTML, PDF, Markdown. Automatic data dictionary, embedded ER diagrams, navigable index for team distribution.
Schema change tracking over time: new tables, added/removed columns, FK changes. Alerts on breaking changes impacting existing dashboards.
Collaborative notes on tables/fields from business users. Wiki-style documentation, shared best practices, useful query examples, warnings on problematic columns.

Integrated Artificial Intelligence for predictive analysis and automation
AI assistant integrated in dashboards for natural language queries. Query your data conversationally, automatically generate SQL, get instant insights.
Custom dashboard item with integrated AI chat. Contextual conversations on displayed data, dashboard export as AI context, session-based chat with history.
Specific AI assistant for reports. Report data analysis, visualization suggestions, outlier identification, narrative text generation from numerical data.
Automatic SQL query generation from text descriptions. AI understands database schema, relationships and generates complex JOINs, WHERE clauses and aggregations.
Automatic suggestions for optimal visualizations based on data. AI recommends dashboard widgets, chart types, appropriate aggregations and dimensions.
Automatic data anomaly detection with machine learning. Alerts on anomalous patterns, outlier detection and trend forecasting with statistical models.
Data exploration via Natural Language Processing. Ask "show me sales by region" and get automatically generated dashboards with applied filters.
Automatic AI summary generation for scheduled reports. Executive summary, key insights, AI-identified trends automatically inserted in email or as PDF first page.
AI assistant for custom C# code generation. Helper for calculated fields, data transformation scripts, integration code with AI-generated inline documentation.
Built with the best enterprise Microsoft and open-source technologies
Request a personalized demo or contact us for more information